

Skip to content

Client case study / Harmony Insurance

Harmony Insurance.

Trucking-focused content, client communication, photography and renewal-timed outreach.

Commercial trucking insuranceApril–August 2026Strategy · Content · Photography · Email

01 / Projected business performance

From quote requests
to new business.

A planning scenario for Harmony’s outbound program, informed by early campaign response.

Harmony Insurance / Commercial trucking

Projected monthly performance

Projected retained agency commission
Annual premium written
Trucking quote requests
Businesses receiving quotes
New accounts bound

Modeled at a 0.75% quote-request rate. Projections, not recorded results; actual outcomes vary.

Premium and retained commission reflect annual policies acquired from each month’s new accounts. Commission is after the producer share, before agency expenses; receipt may occur over the policy term.

Projection assumptions

Audience and response: approximately 3,375 businesses reached per month, with follow-ups, at an assumed 0.75% quote-request rate. Actual reach depends on deliverability, audience availability and timing.

Conversion and value: assumes two-thirds of requests receive quotes, 20% of quoted businesses bind, $20,000 in annual premium per new account, and 7% retained agency commission after the producer share. These assumptions have not yet been validated against completed campaign sales.

Reading the figures: account counts are rounded for display, with binds rounded up to four; premium and commission use the unrounded model. These are annual policy values from each monthly group of prospects, not recurring monthly revenue. Sales and commission receipts may occur in later months; cancellations and agency expenses affect realized income.

“The Weekend Agency manages our marketing and truly understands the trucking insurance industry. Their knowledge allows them to create relevant content that speaks directly to our clients. Their marketing and outreach efforts have strengthened our visibility and consistently generated new quote opportunities for our team.”
SheriOwner, Harmony Insurance Agency

The starting point

An established specialist.
A presence to catch up.

The initial audit found that Harmony’s online presence did not consistently reflect its trucking focus. The work brought its messaging, photography and publishing around the business the agency wanted to write.

Harmony Insurance team members in a working conversation
Original Harmony client photography.

Clarify the focus

Trucking positioning, refreshed profiles and a reporting baseline.

Build the library

75 edited photos from the first session, with a second shoot in Month 4.

Publish & reach out

Insurance articles, client newsletters and renewal-timed outreach with producer follow-up.

Work delivered / Selected examples

The work,
ready to explore.

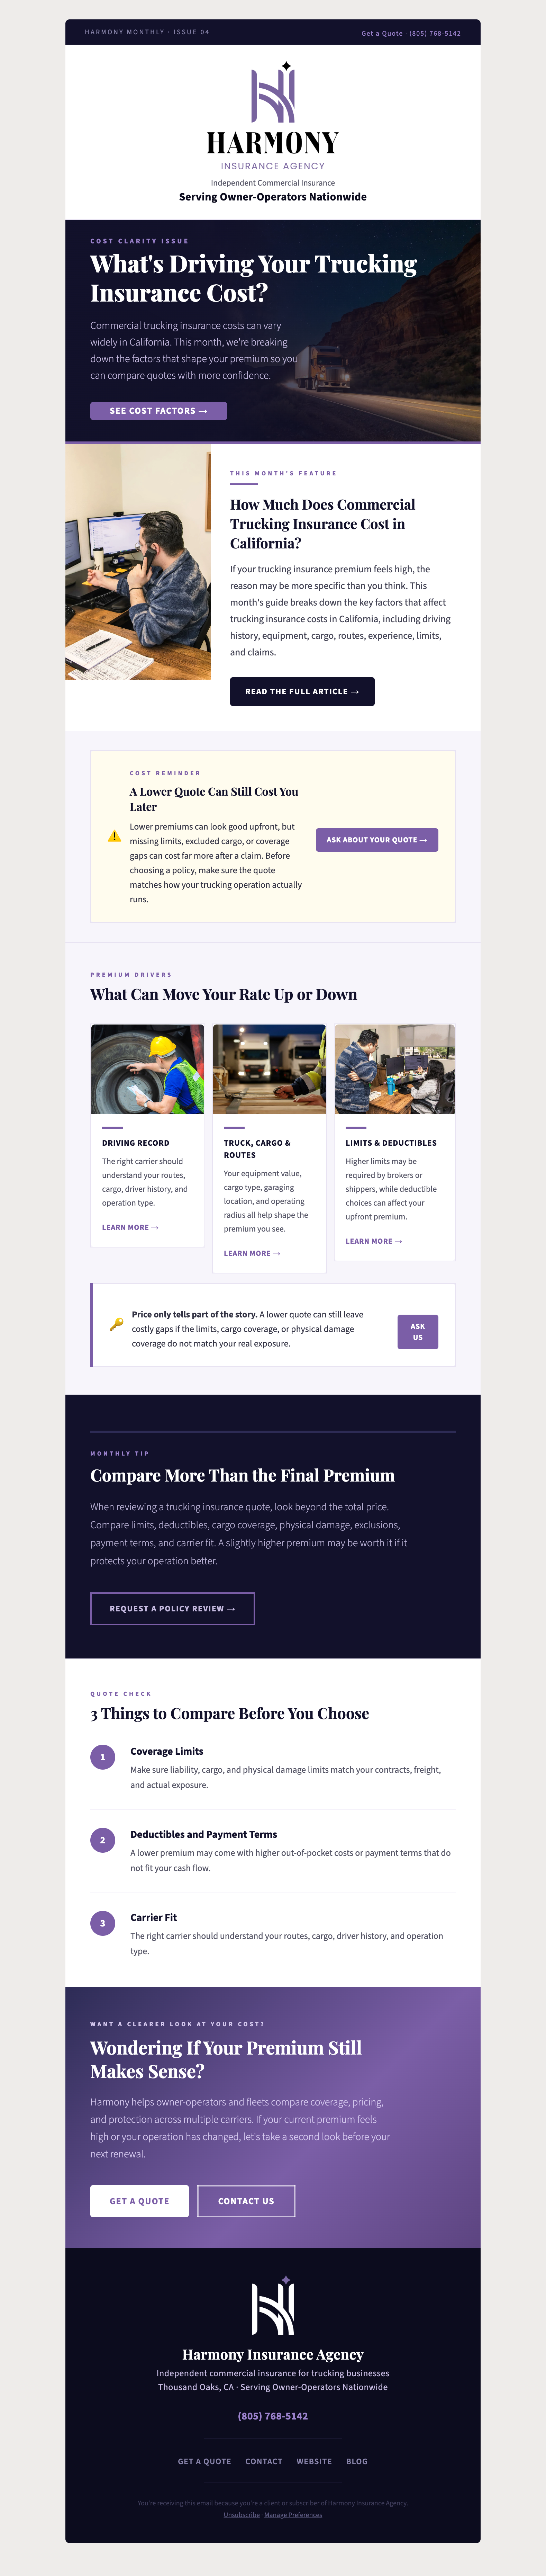
A published trucking article, original brand photography and an actual client newsletter.

Print & photographyOriginal client imagery for a consistent agency presence.
HARMONY INSURANCEEDITORIAL

Client article / July 21, 2026

How to Get Commercial Trucking Insurance With a Bad Driving Record

The article explains how driving history affects insurance options, what information applicants can prepare, and how independent agencies approach more complex records.

4.5This article’s average search position
126Search impressions
8Search clicks

July 22–August 21, 2026 · Month 4 report. Average search position for this specific article during the reporting period, not a fixed or guaranteed Page 1 ranking. Client work, separate from The Weekend Agency Insights.

Read the published client article
Explore supporting channel results and reporting notes

Documented changes / Supporting visibility

More ways to find
and engage with Harmony.

A stronger presence supports the conversations outbound starts. These channel measures show activity, separate from quotes, policies, and agency revenue.

Google Business Profile Month 1 → Month 4 · Change in reported totals

GBP interactions

56 145 reported total

Website clicks from GBP

17 35 reported total

GBP views

254 994 reported total

Changes in reported totals; reporting windows differ in length. These overlapping activity measures are not unique leads and should not be added together.

Source dates & comparison details

Google Business Profile: Month 1 baseline metrics cover May 1–22, 2026; Month 4 covers July 22–August 21, 2026. The Month 1 report cover describes the engagement period as April 22–May 22, but its GBP metrics page specifies May 1–22. The reported values are 56 → 145 interactions, 17 → 35 website clicks, and 254 → 994 views.

Percentages are calculated from those reported totals and rounded to the nearest whole percent. The 22-day and 31-day windows are not equal-length monthly comparisons; the percentages are not adjusted per day. Interactions include website clicks, so these measures overlap.

Instagram: 528 views for June 22–July 21, 2026 (Month 3) versus 1,038 for July 22–August 21, 2026 (Month 4): approximately +97% (96.6% before rounding). Those windows span 30 and 31 days. This comparison is separate from the GBP baseline and is not adjusted per day. Views are not unique people or leads.

See whether this fits your agency.

Talk with Andrew about your appetite, producer capacity and the right starting scope.

Book a 15-minute call
Harmony Monthly · Issue 04Client newsletter preview

Open newsletter in a separate tab ↗